
Operational Performance
Here you can find our analysis of monthly, quarterly and annual operating statistics reported by BC Ferries to the BC Ferry Commission. For ease of reference, the data is held in three separate files, each of which can be downloaded in pdf format by clicking on the title page image.
Monthly Traffic Statistics
Monthly passenger and vehicle traffic statistics comparing each year back to 2021.
Data published by BC Ferries is updated here when available
Monthly traffic statistics for other routes can be found on the BC Ferries Performance page.

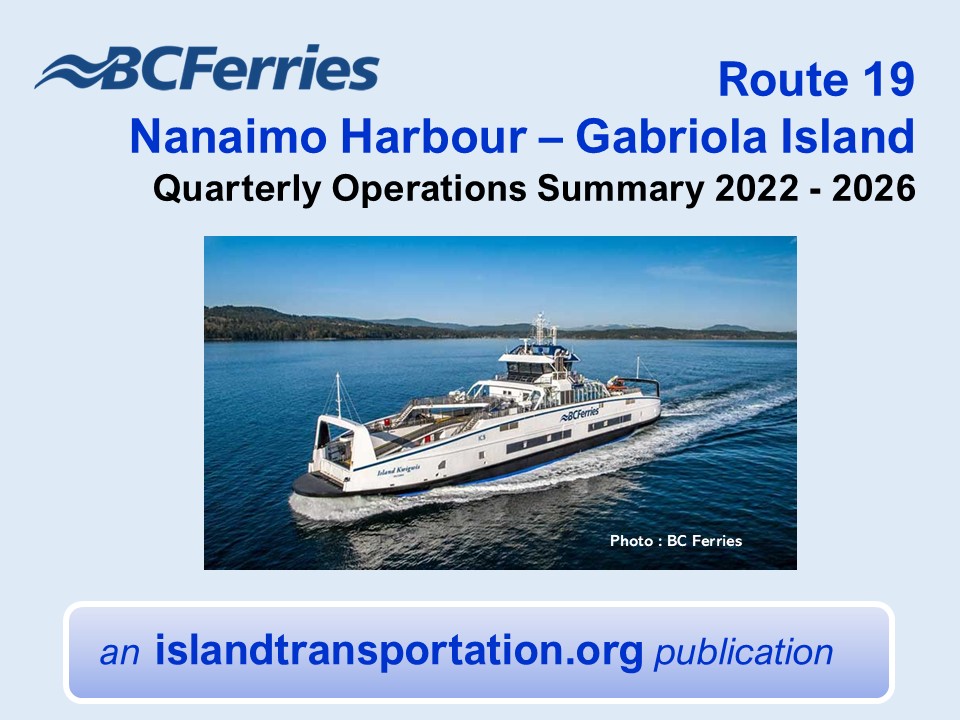
Quarterly Operations Summary
Charts showing average traffic volumes, capacity ulilisation, on-time performance and overloaded sailings.
Data is published by the BC Ferry Commissioner on a quarterly basis and updated here when available
Annual Performance Monitor
Graphs showing long-term trends from 2010 to 2025 in traffic volume, operational performance and customer satisfaction
Data is published each summer in BC Ferries’ Reports to the BC Ferry Commissioner and updated here when available.

These reports are copyright of John C Hodgkins, islandtransportation.org
